March 11, 2026 • 7 min read
Methane slip in LNG-fuelled shipping: A growing challenge on the path to decarbonization
LNG-fuelled ships are playing an important role in helping the maritime sector reduce air pollutants and transition toward cleaner operations. However, even small methane leaks can affect overall climate performance, increase compliance complexity and influence stakeholder confidence.
Key takeaways
- LNG’s climate benefit is conditional. LNG delivers major air‑quality gains, but its greenhouse gas advantage depends on tightly controlling methane slip; even small leakage rates can materially erode climate performance, and real‑world measurements show slip can exceed default assumptions.
- Methane is becoming a regulatory and cost exposure. What was once a marginal emissions issue is now under growing scrutiny from regulators, investors and cargo owners, with methane entering EU and UK carbon pricing frameworks from 2026 and higher slip rates translating directly into higher compliance costs.
- Measurement quality is a strategic differentiator – especially for low‑carbon fuels. Moving from default factors to verified onboard measurements improves transparency and can lower compliance costs, while for bio‑LNG and ammonia the relative impact of shipping emissions means methane slip increasingly drives total life cycle intensity.
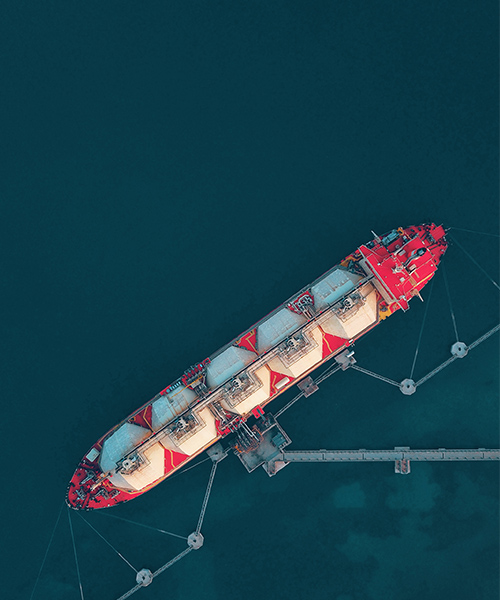
LNG’s growing role in modern maritime fuel
Today, global shipping produces around 1 gigatonne of CO2 equivalent emissions each year, which represent approximately 2–3% of the global total. Marine energy use is still dominated by fossil-based fuel oils but liquefied natural gas (LNG) is being adopted as a lower-emission alternative, particularly where operators are responding to environmental limits on sulphur oxides (SOx) and nitrogen oxides (NOx) emissions.
LNG has been used in shipping for over 65 years, dating back to LNG carriers powered by steam turbines using naturally occurring boiloff gas that have since evolved propulsion technologies to efficient dual fuel engines.
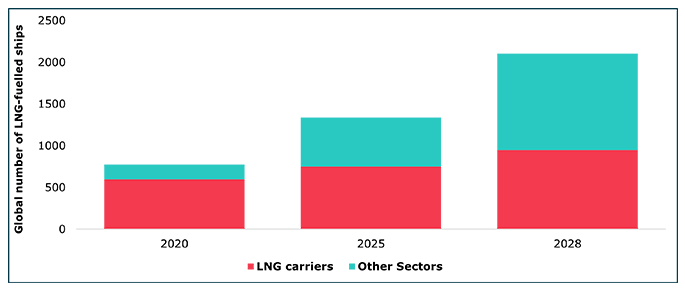
Adoption beyond LNG carriers began in the early 2000s and accelerated from around 2017. Since 2020, the global LNG-fuelled fleet has nearly doubled – from 800 vessels to approximately 1,500 today1 Reference 1,2 Reference 2 – with further growth expected through 2028, increasingly outside the LNG carrier segment.
As a regional example, LNG now accounts for around 8% of EU maritime fuel consumption, equivalent to roughly 3 million tonnes annually3 Reference 3. In modern engines, LNG can reduce greenhouse gas (GHG) emissions by 15–25% compared with conventional marine fuels4 Reference 4, while delivering significant air quality benefits – cutting SOx by around 99%, particulate matter up to 96% and NOx up to 90%. These advantages position LNG as a practical compliance pathway for environmental regulations – while placing greater focus on the emissions that remain harder to see.
Understanding the basics of methane slip and why it matters
Methane slip is methane that escapes unburned from LNG-fuelled‑engines due to fuel bypassing the combustion chamber, incomplete combustion, or through leaks and venting within fuel and engine systems.
Methane has a much higher warming impact, approximately 28 times higher than CO2 over a 100‑year horizon (and around 85 times higher over 20 years), so even small releases significantly increase a vessel’s overall climate impact5 Reference 5.
At higher levels, methane slip can erode or even negate the environmental benefits of switching from conventional fuels to LNG. On a 100‑year basis, the climate advantage effectively disappears once slip approaches around 4%, and beyond this point an LNG-fuelled vessel can even exceed the GHG footprint of a conventional fuelled ship. LNG therefore delivers climate benefits only when methane slip is tightly controlled, even as it continues to offer substantial air quality improvements.
Slip levels are influenced by a combination of engine design and operating conditions, including:
- gas injection method
- engine size
- load profile
- operational modes such as start stop cycles and maneuvring.
In practice, it tends to increase at lower engine loads – such as when vessels are operating near ports or during berthing – and decreases at higher loads typically seen during open sea operations.
Technologies to reduce slip are already available, particularly for newbuild vessels.
These include advances in combustion control and engine design, the use of methane oxidation catalysts in exhaust aftertreatment systems and exhaust gas recirculation. The challenge is less about the absence of solutions and more about how consistently and effectively they are applied across an expanding LNG-fuelled fleet.
Why accurate methane measurement matters
Accurately quantifying methane slip remains one of the most challenging aspects of emissions reporting. Measured operational data is limited. As a result, most global and regional methane emissions estimates are derived from standardized default slip factors assigned by engine types. Reporting has therefore focused less on direct measurement and more on applying the correct default values.
Current regulatory frameworks apply different default factors, typically referenced at 50% engine load, which provide consistency for reporting but can inevitably simplify real-world operating conditions.
| Engine type | IMO slip factor (wt%) | EU slip factor (wt%) |
|---|---|---|
| Dual-fuel medium-speed Otto engines | 3.50 | 3.10 |
| Dual-fuel slow-speed Otto engines | 1.70 | 1.70 |
| LNG–diesel dual-fuel slow-speed systems |
0.15 | 0.20 |
| Lean-burn spark-ignited engines (LBSI) |
2.60 | 2.60 |
| Steam turbines | 0.01 | 0.01 |
Field measurements are challenging the picture. One ICCT study analyzing methane plumes from 18 LNG-fuelled vessels reported an average methane slip of 6.4% for low-pressure, dual fuel four stroke engines, well above EU (3.1%) and IMO (3.5%) defaults and recommended revising defaults upward to better reflect real-world conditions.
Industry and engine manufacturer commentary have argued the opposite: current default values reflect 2015–2020 technology and may be high relative to newer state-of-the-art engines, and limited samples and operational variability can skew results. The practical takeaway is not that one number is ‘right’, but that uncertainty remains and better measurement and verification is becoming central to credible reporting and decision making8 Reference 8.
Rising cost and regulations exposure
Methane slip already has a financial consequence, as the resulting ‘wasted’ fuel – either fuel that needs to be repurchased, or lost product for LNG carriers. However, regulatory obligations are tightening, and methane emissions will soon have further direct carbon-cost exposure for shipowners and operators.
In Europe, key milestones include:
- Under the EU Emissions Trading System (ETS), methane emissions occurring from 1 January 2026 onward must be fully accounted for in the 2027 compliance cycle4 Reference 4.
- From 1 July 2026, the UK ETS will apply to the maritime sector and will cover both methane and CO29 Reference 9.
An obligation to report methane slip has been in place under the EU MRV (Monitoring, Reporting and Verification) regulation since the start of 2025, and from 2026 it falls within the scope of EU ETS. A new guideline, published on 8 October 2025, outlines procedures for verifying actual methane slip emissions from marine diesel engines10 Reference 10 – an important step toward measured, verifiable data rather than default values alone.
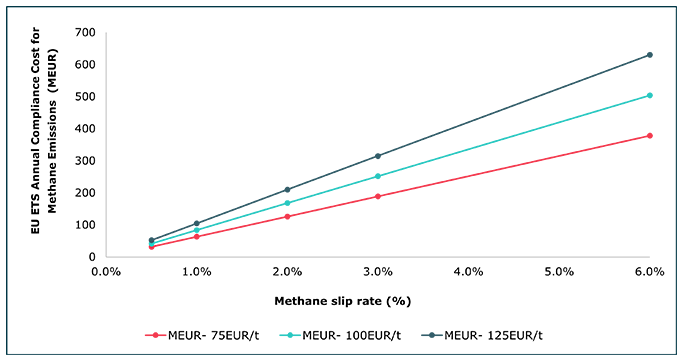
Figure 2: Estimated annual ETS compliance costs for varying methane slip rates and carbon prices
As illustrated in Figure 2 above, ETS liabilities rise sharply with higher slip rates and carbon prices. An EUA price of €75/tonne is representative for 2025, and at a consensus estimate of €125/ tonne carbon price in 203011Reference 11, even a 3% slip rate would push annual compliance costs for the EU maritime sector above €300 million, and this reflects only the current LNG-fuelled fleet, which is expanding rapidly.
Implications for LNG’s transition role for low carbon cargo
While there is little evidence methane slip concerns are materially slowing LNG adoption, it does add uncertainty to the claims of GHG savings, and the economics of LNG‑fuelled operations under carbon pricing. At the same time, the market demands greater transparency with increased global focus on reporting scope 3 emissions, including feedstock emissions.
The EU ETS and Fuel EU Maritime are starting to offer pathways to replace defaults with verified onboard measurements8Reference 8. This provides a strategic advantage: verified performance can reduce compliance costs where actual slip is lower than defaults and strengthen the credibility of emissions claims; where performance is higher, it focuses attention on where operational changes or technology upgrades matter most.
The effect is amplified for lower‑carbon products. As production and end-use emissions fall toward zero for fuels like bio‑LNG, green methanol and green ammonia. Their current adoption is limited by high cost, limited availability and infrastructure constraints, making transport emissions become a larger share of total life cycle impact.
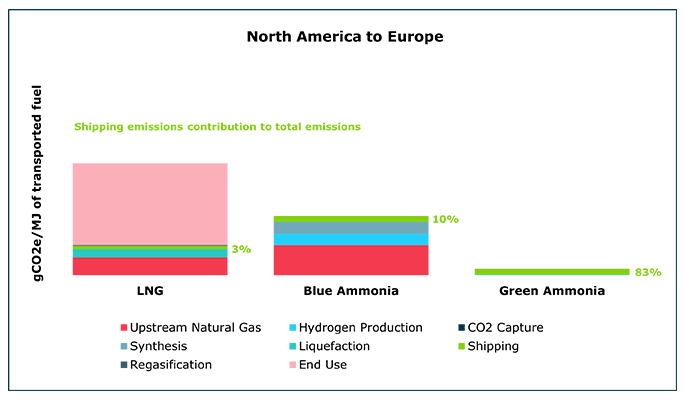
Figure 3: Contribution of shipping emissions to total life cycle emissions for LNG, blue ammonia, and green ammonia
As shown in Figure 3 above, based on our in-house analysis that assumes a methane slip of approximately 2% for transatlantic shipping between North America and Europe. Shipping may only contribute about 3% of life cycle emissions for conventional LNG, 10% for blue ammonia production, and can exceed 80% for green ammonia. Even relatively small changes in methane slip can therefore cause a noticeable increase in total well-to wake emissions, particularly for low carbon cargoes.
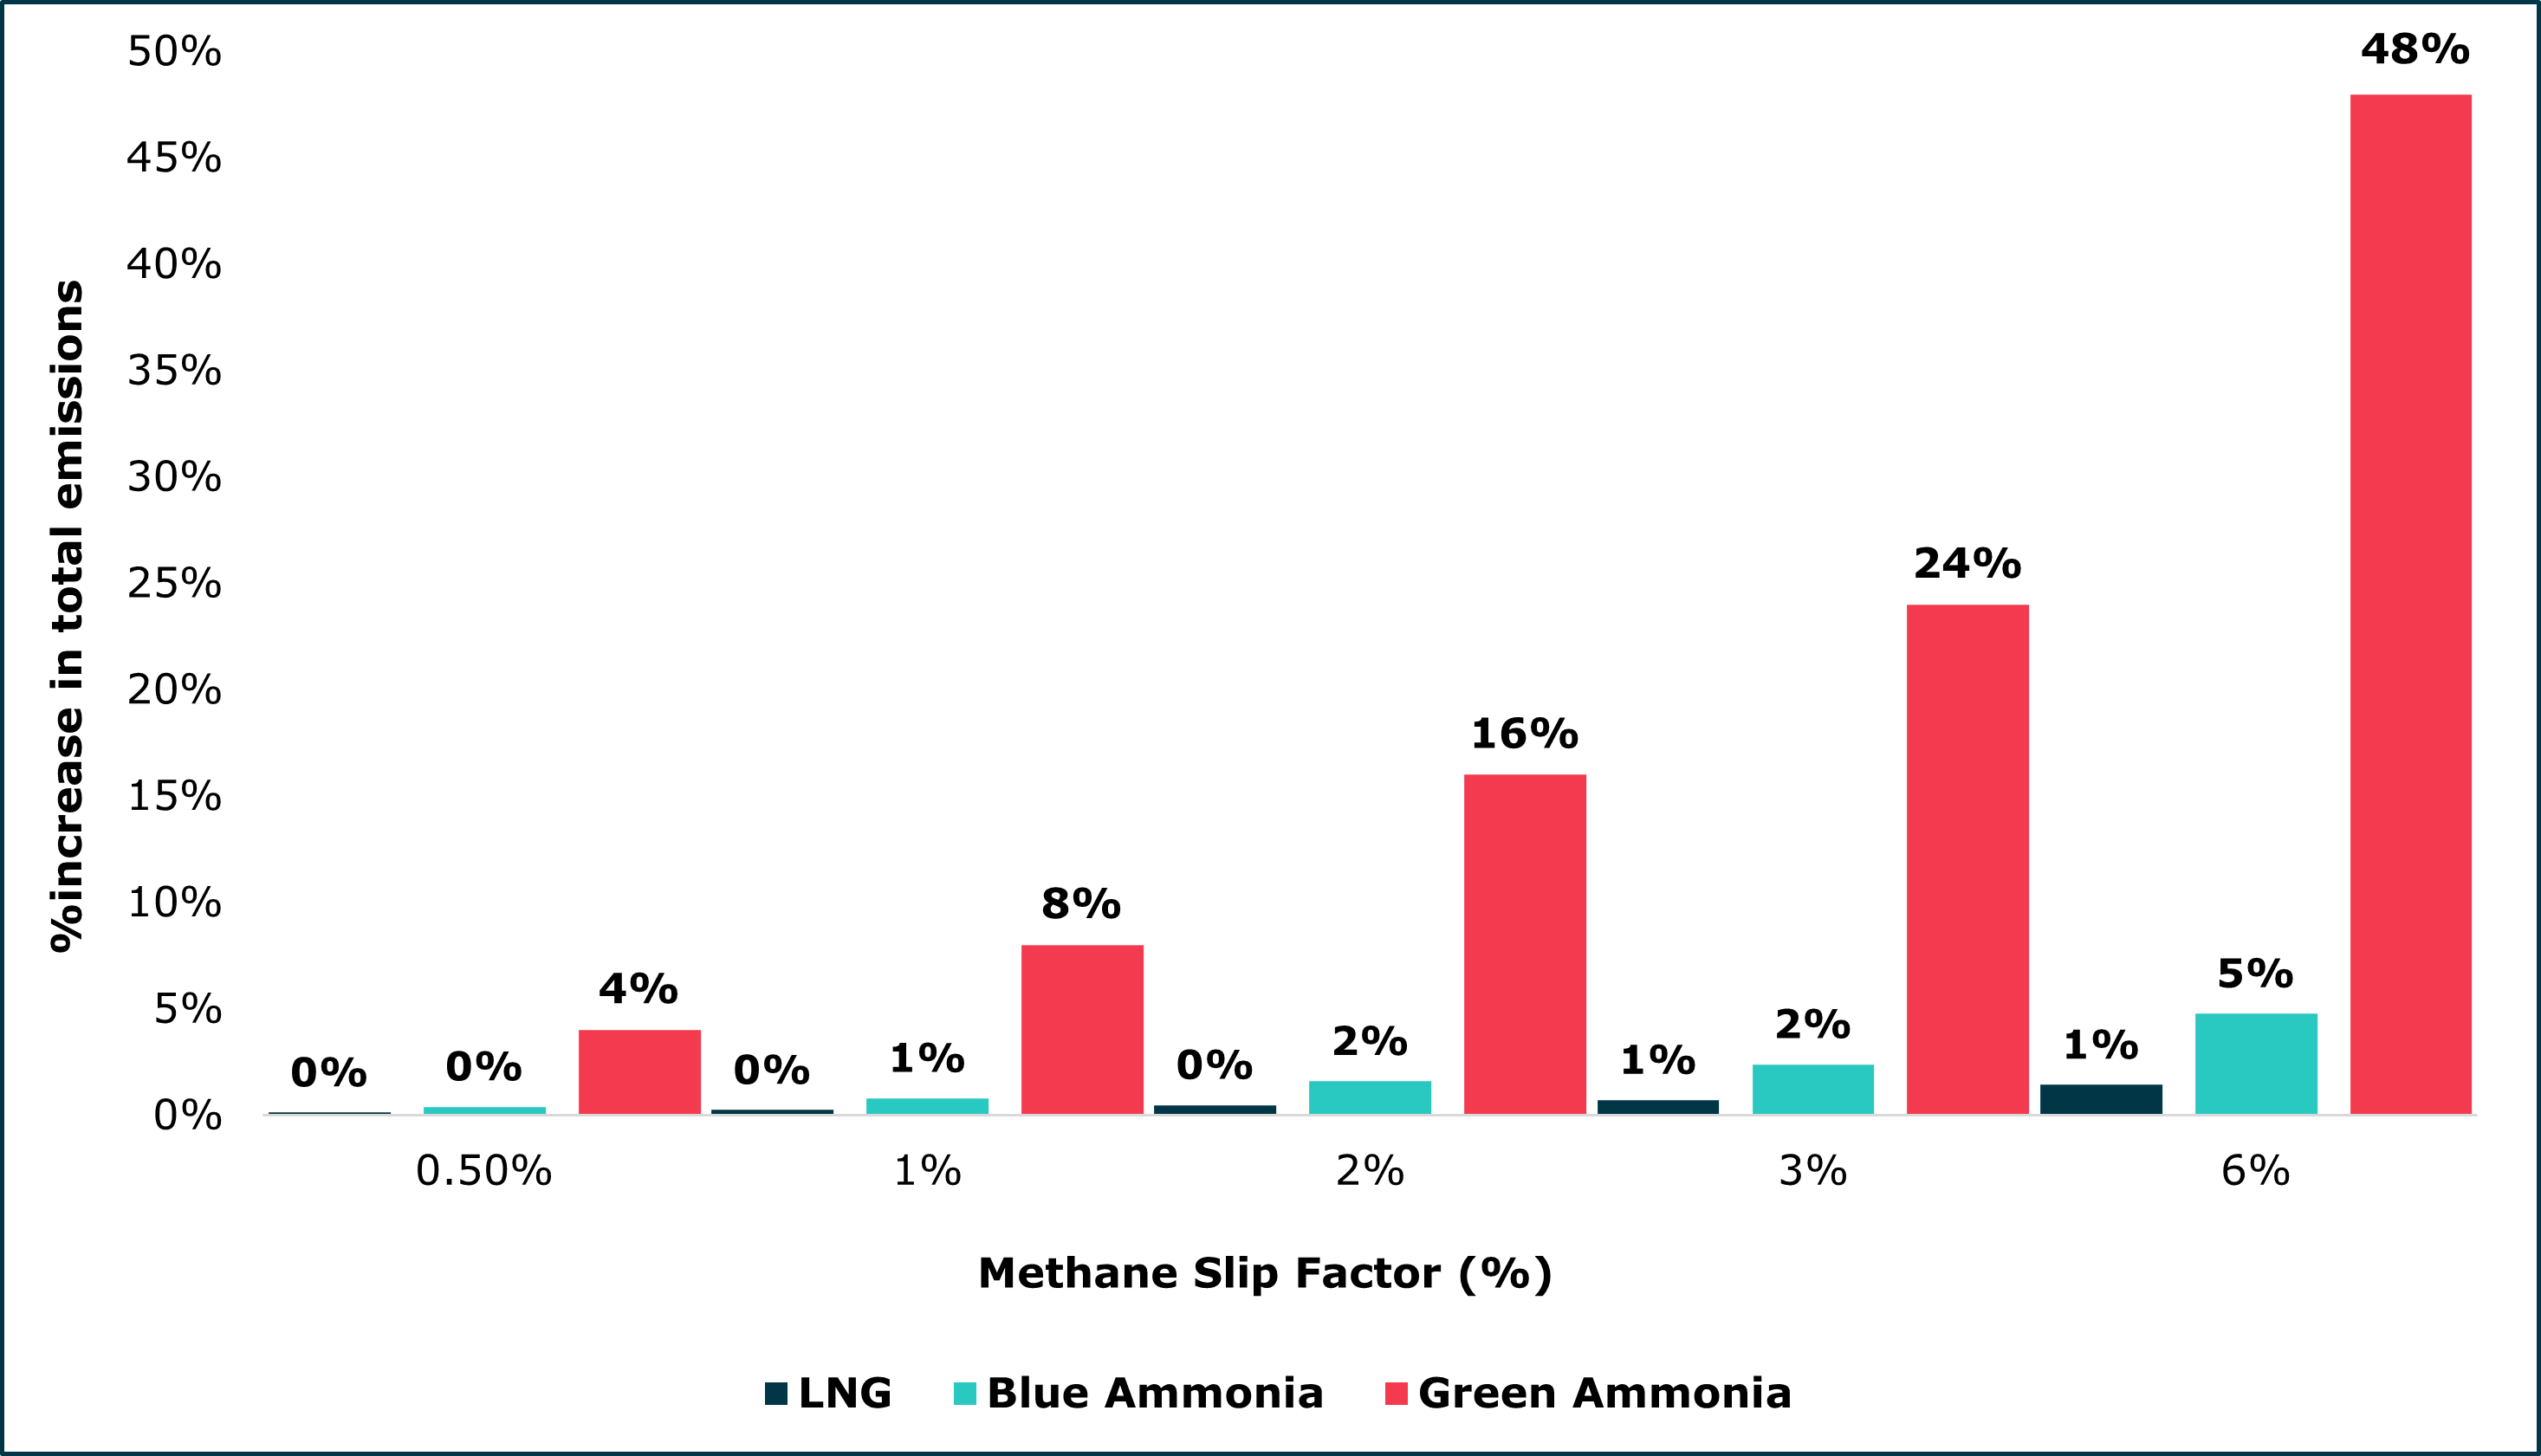
Figure 4: % increase in total life cycle emissions for LNG, blue ammonia, and green ammonia at varying methane slip rates
Variation in the values has a major impact upon the overall carbon intensity of the shipped products. Hence, uncertainty in the levels undermines confidence in final carbon intensity values for these products.
The shift from uncertainty to action
The LNG sector has made meaningful progress on emissions transparency along the supply chain but scaling consistent reporting and verification practices across diverse regulatory and commercial landscapes remains challenging.
Practical approaches start with applying the most up-to-date guidance and emission factors, screening material sources, and prioritizing mitigation where it will deliver the greatest impact.
Worley’s EmissionsView platform supports route and vessel screening to help align reporting with the highest quality data available and focus effort on the most material emissions sources.
Figure 5 below presents a snapshot of the EmissionsView interface, illustrating how users can input operational data to support the screening and verification of emissions.
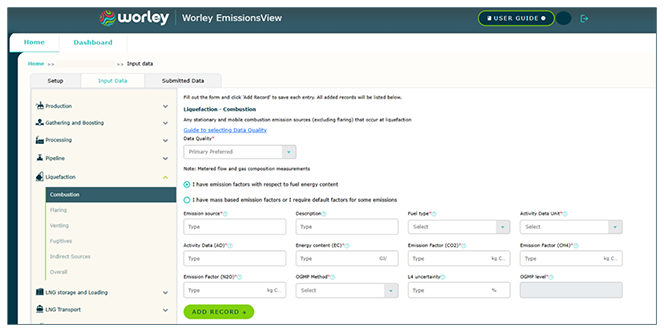
Figure 5: Worley EmissionsView interface
Preparation for the path ahead
LNG is likely to remain an important maritime fuel in the near term due to its overall environmental benefits, but its climate performance depends on effective management of methane slip.
European policy is already translating methane slip into direct cost exposure and enabling verified measurements that are a positive step – improving accuracy, reducing compliance costs for better performers and encouraging adoption of low-slip technologies.
While zero or near-zero emissions fuels (ZNZs) are expected to grow over time, the current growth in LNG-fuelled ships and long lifetime of vessels amplifies the importance of understanding, measuring and controlling methane emissions today.
Organizations that invest early in high-quality measurement, transparent reporting and low-slip engine designs will be better positioned to manage risk and compete effectively in a carbon-constrained future.
References
- SEA-LNG. Global Fleet – LNG as a Marine Fuel. Available at: https://sea-lng.org/why-lng/global-fleet/ Return to reference 1 ↩ Back to content
- DNV. Alternative Fuels Insight (AFI) Platform – Fleet and Fuel Projections. Available at: https://afi.dnv.com Return to reference 2 ↩ Back to content
- European Commission. (2025). Commission staff working document – 2024 Report from the European Commission on CO₂ emissions from maritime transport (SWD (2025) 38 final). Available at: https://climate.ec.europa.eu/… Return to reference 3 ↩ Back to content
- FortisBC. Environmental Benefits of LNG‑Fuelled Marine Vessels. Available at: https://www.fortisbc.com/… Return to reference 4 ↩ Back to content
- European Commission. Guidance Document: EU ETS and Maritime Transport. Available at: https://climate.ec.europa.eu/… Return to reference 5 ↩ Back to content
- International Maritime Organization (IMO). (2023). Annex 10: Guidelines for the development of a Ship Energy Efficiency Management Plan (SEEMP). Adopted at MEPC 81. Available at: https://wwwcdn.imo.org/… Return to reference 6 ↩ Back to content
- European Commission. (2023). Commission Delegated Regulation amending Regulation (EU) 2015/757. Available at: https://eur-lex.europa.eu/… Return to reference 7 ↩ Back to content
- International Council on Clean Transportation (ICCT). (2024). Fumes: Characterizing methane emissions from LNG‑fueled ships using drones, helicopters, and on‑board measurements. Available at: https://theicct.org/… Return to reference 8 ↩ Back to content
- Department for Energy Security and Net Zero. (2024). UK Emissions Trading Scheme Scope Expansion: Maritime. Available at: https://assets.publishing.service.gov.uk/… Return to reference 9 ↩ Back to content
- European Commission. Guidelines for Reporting and Verification of Actual Methane Slip Tank‑to‑Wake Emission Factors. ↩ Back to content
- GMK Center. (2024). Carbon price in the EU ETS to hit €126/t by 2030. Available at: https://gmk.center/… Return to reference 11 ↩ Back to content
Contributing authors

Amanjot Kaur
EMEA Low Carbon Consultant, Worley Consulting

Ian Moore
Technical Director, EMEA Low Carbon, Worley Consulting
Speak to an expert today